We’re now well into the first full school year since the last bit of federal pandemic relief funding dried up. As we’ve pointed out in the past, some districts are feeling the loss of those dollars more acutely than others, but most are still budgeting cautiously.
Without a doubt, districts’ fiscal confidence has been rattled by the “stops-and-starts” of federal funding and other compliance uncertainties. But despite what headlines suggest, the major federal line items remain largely unchanged. So what’s driving the K-12 financial challenges that so many of us are hearing about? As it turns out, it has little to do with what’s happening in Washington.
In most places, state and local budgets are now set through June 2026, barring any mid-year changes in state revenue. Even Pennsylvania, which is famously slow to pass a spending plan, got one on the books this week. And because K-12 schools are forward funded, funding levels for the current school year were locked in long before the government shutdown.
However, state revenues are beginning to flatten after years of growth. Fixed costs like wages, transportation, and insurance are rising, and district leaders are prioritizing those line items over spending on new programs or vendors.

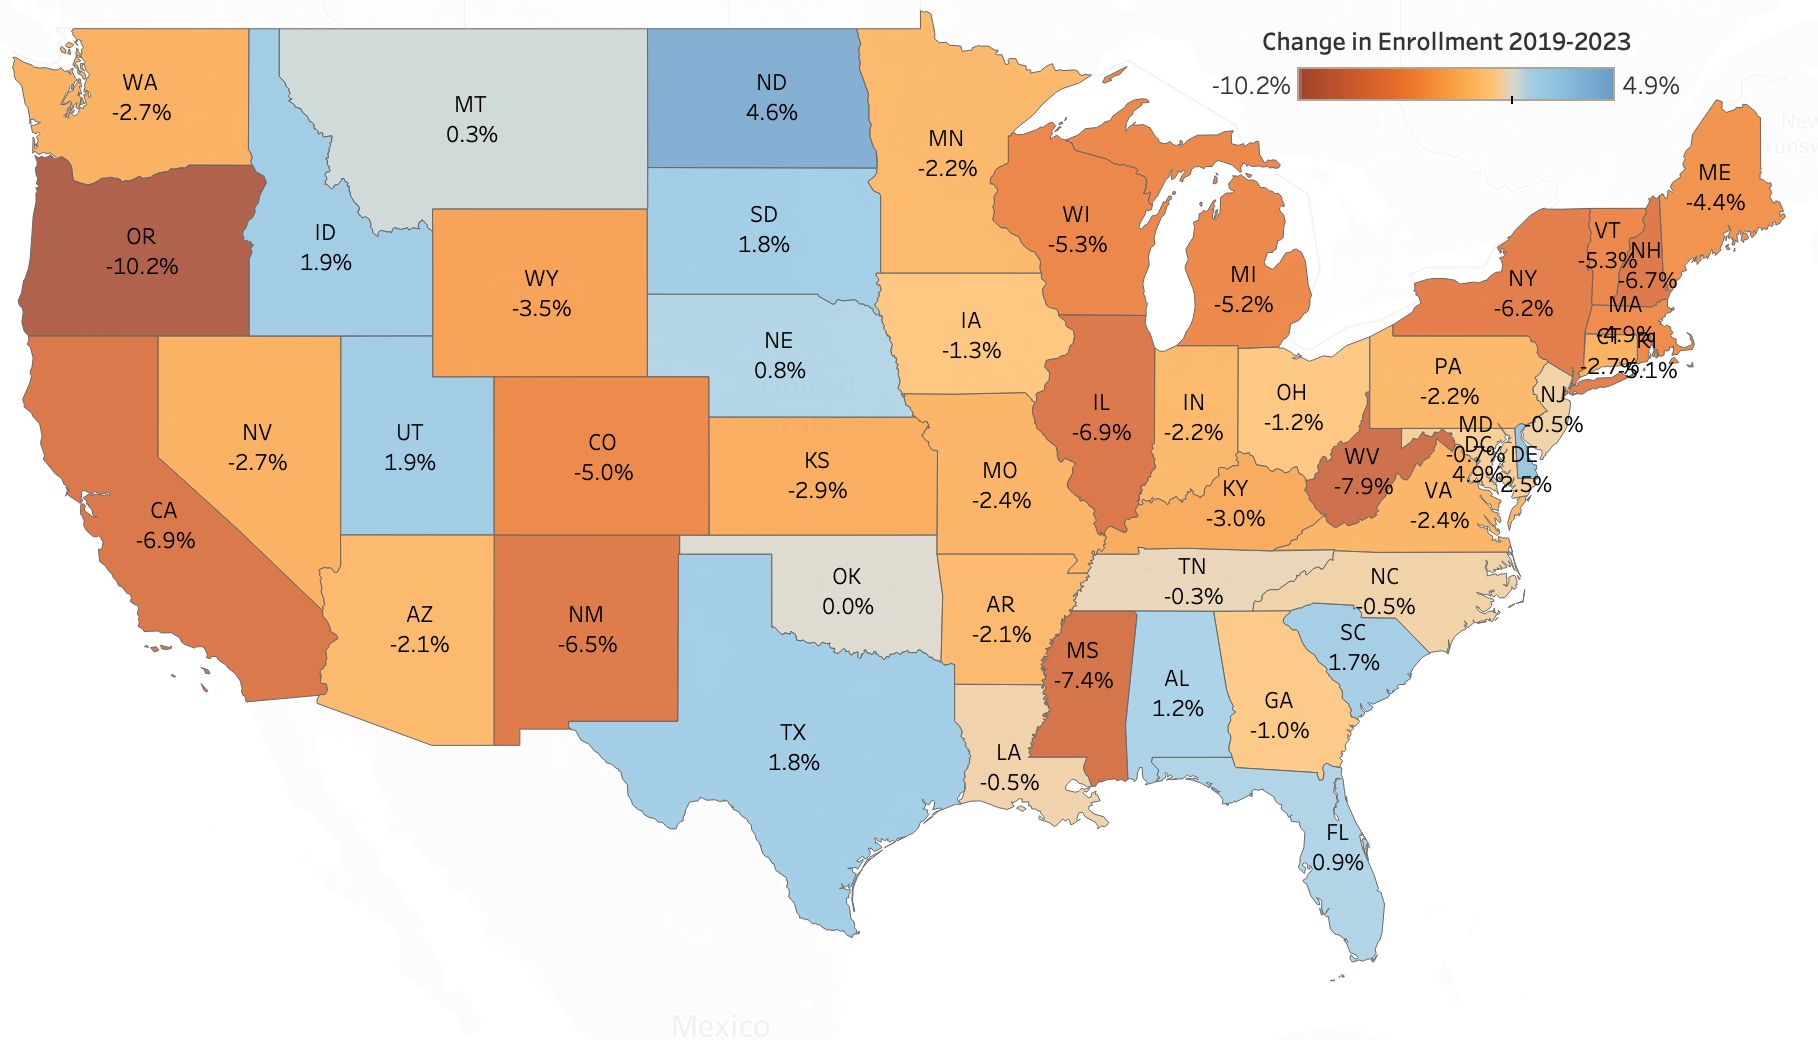
Enrollment is also falling. Oregon (-10.2%), West Virginia (-7.9%), and Mississippi (-7.4%) have seen the steepest declines between 2019 and 2023. Demographic shifts are accelerating enrollment declines, too: the National Center for Health Statistics found that the birth rate has dropped from 2.1 children per woman in 2007 to just under 1.6 in 2024—the lowest in U.S. history.
Although the dollars are still relatively small, states are also reallocating funds toward priorities that sit outside traditional Local Education Agencies, like charter schools and voucher programs. 18 states now operate 20 Education Savings Account (ESA) programs, which allow parents to redirect public per-pupil funds to school choice options—and school boards are weighing how they impact budgets. Ultimately, these decisions are not shrinking the pie, but they are impacting who gets a slice.
As a result, districts that previously relied on stable, if not growing, headcounts are now confronting a new reality: smaller class sizes, lower funding, and compulsory fiscal conservatism. Consider a Minnesota example. The state has a “Blue Ribbon Commission” to find (somehow) $250 million in special education savings—a category with the most fiscal protection, typically. But we are not in typical times.
The next few months will bring more clarity. In mid-December, states will begin forecasting revenues for 2026, and governors’ budgets will follow early in the new year; because the federal government only supplies about 10% of district funding, these numbers are critical. And with 36 gubernatorial races on deck in 2026 (more than half without incumbents running), we can anticipate some more significant shifts in state education funding priorities.
We’re also watching:
- Staffing Trends: The biggest cost-driver for a district.
- Special Education: Another high cost-driver—and with more kids being identified for special education, the rates are rising.
- Local Levies: Districts are having mixed success getting local levies—which pay for facilities projects, programs, and other “extras”—passed. These local funds can be crucial in times of fiscal flux, but voters remain unconvinced.
- Competitive Grants: A recent notice in the Federal Register suggests that higher ed competitive grants will focus on AI, civil discourse, accreditation reform, and short-term credentials, which may hint as to what’s on the horizon for K-12.
- Federal Tax Credit Scholarships: Blue state governors have been feeling the pressure to approve the One Big Beautiful Bill Act (OBBBA)’s federal tax credit scholarships at the state level. These scholarships could bring districts a new source of education funding, but also may contribute to enrollment challenges. We’ll be tracking which states sign on.